Where to find Consent Statistics
You can enable Consent Statistics in your dashboard.
Go to Tools > Statistics.
Select Enable consent statistics.
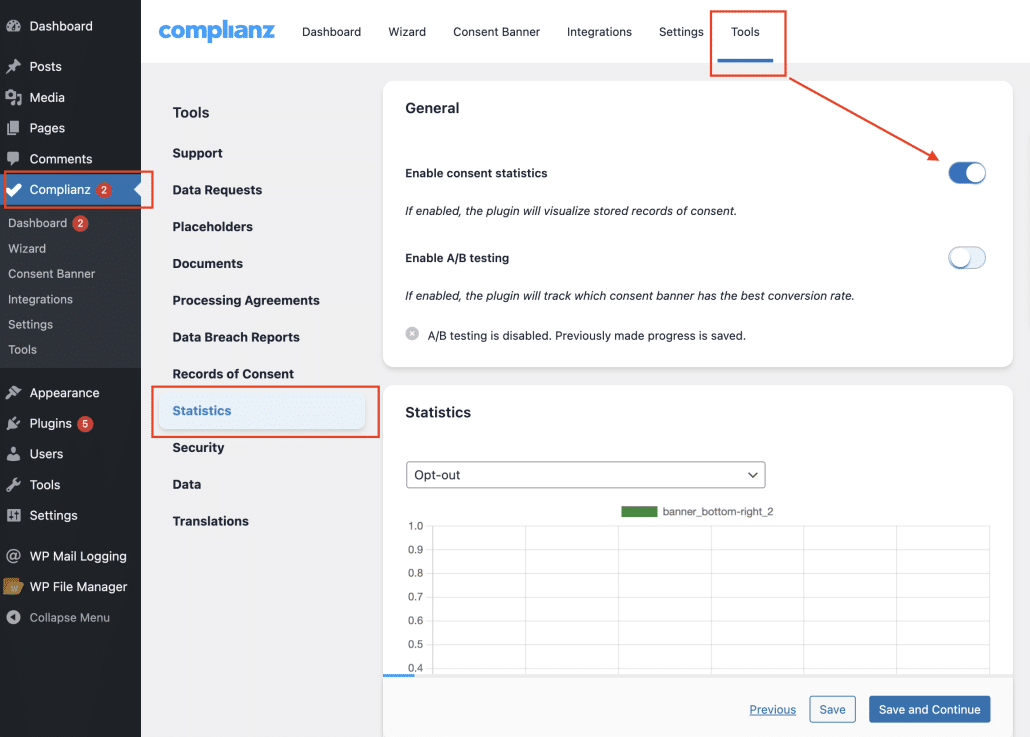
After activation, Complianz begins storing anonymized consent records. The results appear in two areas of your dashboard:
Tools > Statistics – A detailed section where you can turn consent statistics on or off and optionally enable A/B testing.
Complianz Dashboard – A small widget that shows the same data in a compact format.
Both areas show identical data, so you can use whichever view you prefer.
See here where to find them in your dashboard: ⬇️
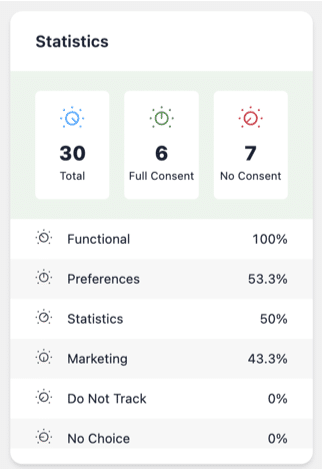
Statistics Widget in the Dashboard
Total, Full Consent, and No Consent
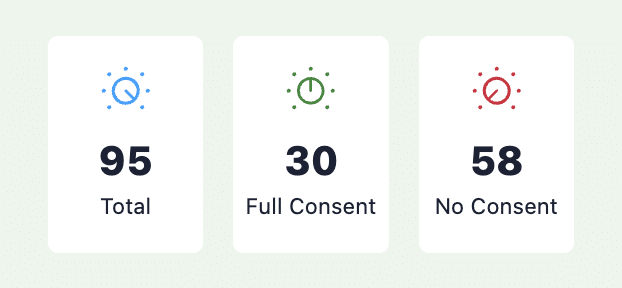
Three key metrics in the statistics overview in the Dashboard are Total, Full Consent and No Consent:
Total is a general counter that increases with every interaction with the banner, whether the choice was full consent, denial, or a partial selection. This gives you an overview of how many times the banner has been actively used by visitors.
Full Consent means that a visitor has accepted all available categories: functional, preferences, statistics, and marketing.
No Consent means the visitor only allowed strictly necessary cookies (functional), while all optional categories remained disabled.
Tracking these values helps you understand not only the extremes (full approval vs complete opt-out), but also the overall level of engagement with your consent banner.
Per-Category Insights
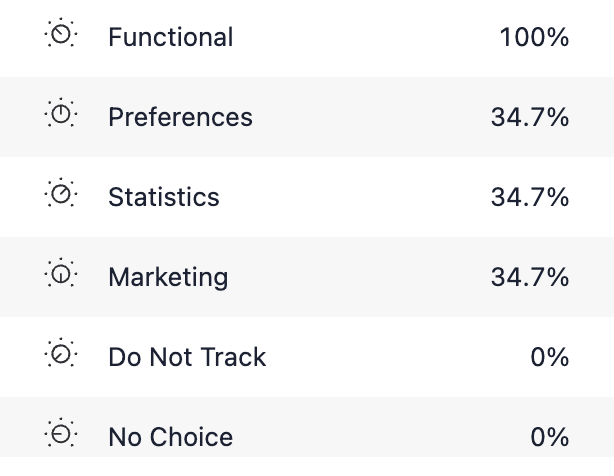
Beyond the extremes of “all” or “none,” Complianz also provides a breakdown per category. For example, you can see how many visitors agreed to Marketing cookies but disabled Statistics cookies, or vice versa. You can view the exact number for each category by clicking on the percentage displayed in the dashboard.
The percentages shown are calculated based on the Total interactions. For instance:
In this example, the Total number of interactions is 30.
Out of these, 6 were Full Consent and 7 were No Consent, leaving the remaining 17 as partial selections.
For each category, the percentage indicates how many of those 30 interactions included that category:
Functional is always 100%, since strictly necessary cookies are enabled in every case.
Preferences was accepted in ~53.3% of the consents (16 out of 30).
Statistics was accepted in ~50% of the consents (15 out of 30).
Marketing was accepted in ~43.3% of the consents (13 out of 30).
Do Not Track, No Choice and No Warning remain at 0% in this sample, as no visitor triggered those options.
This way, the percentages don’t just reflect the ratio among “full” or “none,” but the actual acceptance rate per category relative to the total number of times the banner was used.
💡 In addition, the statistics widget includes a dropdown selector, which allows you to switch between the opt-in and opt-out banner results. This makes it easier to compare how users interact with different consent types directly from the dashboard.
Please note: the widget is not affected by A/B testing and will always display the combined data from all banners.
This data is especially valuable if you’re testing different banner configurations or wording: by comparing results, you can evaluate which design leads to higher opt-in rates for specific categories.
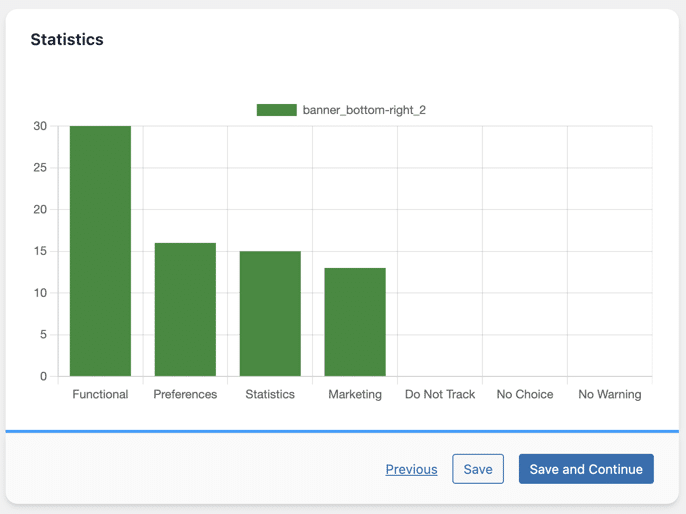
Statistics Bar Chart in the Statistics menu
In addition to the widget in the dashboard, the Statistics menu also includes a bar chart visualization. Here, the same consent data is displayed in the form of bars, where each bar represents the actual count for a category instead of a percentage. This makes it easy to see at a glance how many times a category has been accepted.
Just like in the widget, a dropdown selector allows you to switch between the opt-in and opt-out banner statistics.
Furthermore, if you have A/B testing enabled, the bar chart will automatically compare the performance of Banner A and Banner B, giving you a clear side-by-side overview of which banner drives higher consent rates.
Totals and Time Frames
Consent statistics are stored in a dedicated database table and queried over time. This means you can look at both:
- Totals per consent type (e.g., total number of “opt-in” consents collected).
- Time-based trends (e.g., how many users granted consent since a given date).
While the Complianz dashboard provides a visual overview, the raw numbers are only accessible on the database level. These records are stored in the cmplz_statistics table, which makes it easy to run your own queries or export the data for external analysis.
This ensures you’re not only seeing a static number, but also have the flexibility to perform deeper analysis tailored to your needs.
Optional: A/B Testing
Alongside statistics, Complianz Premium also offers an A/B testing feature. When enabled, it tracks which version of your cookie banner achieves the highest conversion rate. By combining A/B testing with consent statistics, you can optimize your banner design based on real user behavior rather than assumptions.